

Solability published The 2020 Sustainable Competitiveness Index!
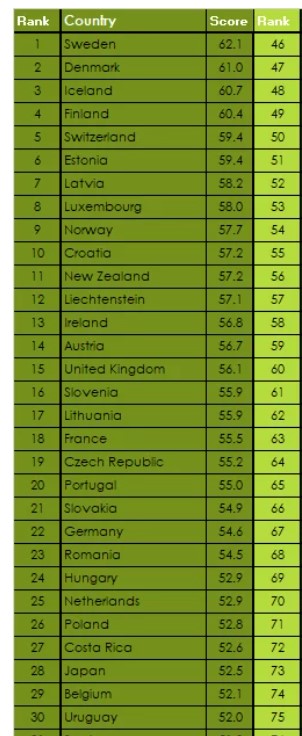
- Sweden tops the GSCI for a 5th consecutive year, followed by Iceland, Denmark, Finland, & Switzerland
- UK is ranked 15, Germany 22, The Netherlands 25, US 32, China 39
- North-East Asia (South Korea, Japan, China) keep dominating the Intellectual Capital sub-index, while Scandinavia tops the Social Capital sub-index
- Conventional credit ratings do not reflect ESG risks/opportunities and need to be adjusted
Country success is commonly expressed as GDP. However, GDP numbers fail to reflect the underlying elements that shape the development of a country. Alternatively, there is the WEF “Competitiveness Index”, largely based on perception surveys and insufficient integration of ESG factors. The Global Sustainable Competitiveness Index is based in 127 quantitative (not quantitative!) indicators across the dimension that shape a country: natural capital, resource efficiency, social capital, intellectual capital, governance performance. The Global Sustainable Competitiveness Index is the most accurate reflection of country performance & development.
Take-aways from the 2020 Sustainable Competitiveness Index:
- The 2012 Index is dominated by Scandinavia and other Northern- European nations, including the Baltic states.
- The only non-European contenders in the top 20 is New Zealand (11), followed by Japan (28), Uruguay (30), and South Korea (35).
- Of the World’s largest economies, the UK is ranked 15, Germany 22, Japan 28, the US 32, and China 39. The US is scoring particularly low in social issues, and resource intensity – indicating the danger of decline but also cost reduction opportunities. Brazil is ranked 54, Russia 48, and India 127.
- The highest ranked African country is Ghana (60). South Africa is ranked 157, while Nigeria, Africa’s most populated nation, is ranked 149.
The Top 30
Global trends
The GSCI is based on the latest available data series, but also on data trends to evaluate whether a specific country is going in the wrong or the right direction and to better reflect the future outlook. The accumulated trends for all countries allow us a glimpse into where our World as a whole is heading:

58% of accumulated trends across all countries are positive, while 38% are going the wrong direction. In Resource efficiency, 44% of trends are negative while in natura capital more than half (51%) are going the wrong way – underscoring the need for better resource efficiency, environmental management, and conservation of the natural environment on the global level.
Sovereign Bond rating: lack of ESG integration
Sovereign bond ratings determine the credit worthiness of a nation and the interest rate they have to pay on their debt. It is therefore a very significant figure. Conventional credit ratings are based on economic and fiscal numbers and valuation of political developments. They do not take into account the fundamentals that lead to economic numbers or social/environmental developments that shape the future. A comparison between current ratings (average of Moody’s, S&P, and Fitch) and GSCI ratings shows substantial differences:

Generally speaking, richer countries credit ratings are too high, while poorer countries rating is too low. The case of oil/gas rich nations also shows that investor risks are not reflected in the credit ratings. It is high time that sovereign bond ratings incorporate ESG factors, benefiting both debtors and reducing the investor risks.
Bron: Solability